Để thêm tuần / văn bản
dữ liệu bên dưới các cột mà bạn phải thêm vào tệp danh mục của thư viện jquery.flot.categories.min.js vào nội dung javascript của bạn.
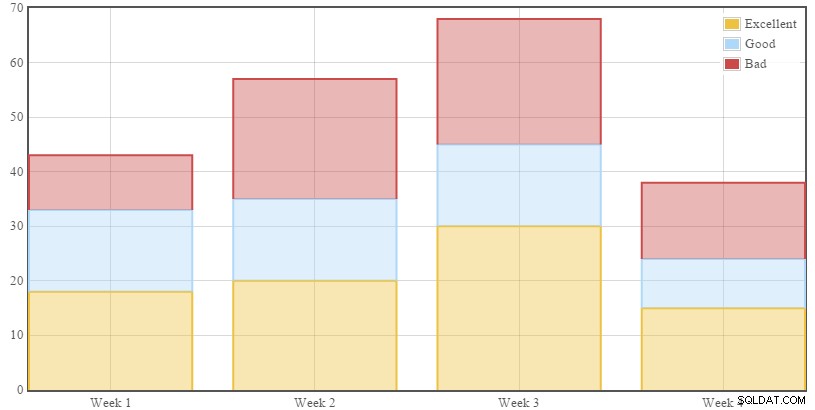
Nếu tôi hiểu đúng về bạn, bạn muốn biểu đồ trông như thế này

Javascript
Bạn cần thêm các tệp này vào
<script src="//ajax.googleapis.com/ajax/libs/jquery/1.11.1/jquery.min.js"></script>
<script src="jquery.flot.min.js"></script>
<script src="jquery.flot.categories.min.js"></script>
<script src="jquery.flot.stack.min.js"></script>
và khởi tạo thư viện mà chúng ta sẽ nói về $output sau mã này
<div id="placeholder" style="width:818px;height:413px" ></div>
<script type="text/javascript">
$(function() {
    var series = [<?php echo $output; ?>];
       $.plot("#placeholder", series, {
        series: {
            stack:true,
            lines:{fill:true,show:false,steps:false},
            bars: {
                show: true,
                barWidth: 0.8,
                align: "middle",
            },
        },
        xaxis: {
            mode: "categories",
            minTickSize: 1
        }
       });
});
PHP
Đầu tiên, bạn cần truy vấn cơ sở dữ liệu để tìm ngày giữa các ngày đã chỉ định, sau khi nhận được kết quả, bạn phải sắp xếp dữ liệu cho từng tuần trong một mảng
Ví dụ:week One => 'good','good','bad','bad', 'week two' => and so on ...
sau đó, bạn có thể sử dụng array_count_values()
để đếm số lần xuất hiện và xây dựng cột biểu đồ.
Tôi đã đơn giản hóa mã bằng cách sử dụng các hàm functions để giúp bạn dễ dàng hơn
<?php
$con = mysqli_connect("localhost", 'root','','your db');

function getChartData($con, $startDate, $endDate){

    $startDate = date("Y-m-d H:i:s", strtotime($startDate));
    $endDate = date("Y-m-d H:i:s", strtotime($endDate));

    $query = "SELECT * FROM `employees` WHERE `date` BETWEEN '$startDate' AND '$endDate'";

    $result = mysqli_query($con, $query) or die ("Error: ".mysqli_error($con));

    // a multidimenional array containing each week with it's
    $weeksData = [];

    // Group each week with it's data
    while($row = mysqli_fetch_array($result)){
        $weekNumber = date("W", strtotime($row['date']));
        if(isset($weeksData[$weekNumber]))
        {
            $weeksData[$weekNumber][] = $row['level'];
        }
        $weeksData[$weekNumber][] = $row['level'];
    }

    // reset array indexes and sort the array
    sort($weeksData);

    $data = array();

    // using array_count_values to count the number of (good, bad and excellent)
    foreach ($weeksData as $key => $week) {
        $data[$key] = array_count_values($week);
    }

    // return all the weeks with number of (good, bad and excellent) occurences
    return $data;
}

// build the javascript object {data:['week num', occuerences]}
function buildColumn($data,$label, $numberOfWeeks)
{
    $data = array_column($data,strtolower($label));
    $balance = $numberOfWeeks - count($data);
    if($balance !=0){
        for($i=1;$i<=$balance;$i++) {
            $data[] = 1;
        }
    }

    $string = '{data: [';
    foreach ($data as $key => $value) {
        $weekNumber = $key+1;
        $string .= '["Week '.$weekNumber.'",'.$value.'],';
    }
    $string = rtrim($string, ',');
    $string .= "],valueLabels: {show: true,valign: 'middle'},label: '$label'}";
    return $string;
}

function getNumberofWeeks($startDate, $endDate){
      $weeks = array();
      $period = new DatePeriod(new DateTime($startDate),
        DateInterval::createFromDateString('+1 day'),new DateTime($endDate)
      );
      foreach ( $period as $dt ) {
        $weeks[] = $dt->format( 'W' );
      }
      return count(array_unique($weeks));
}
bây giờ bạn có thể dễ dàng sử dụng các chức năng như thế này
$numberOfWeeks = getNumberofWeeks($_POST['start'],$_POST['end']);

// get data of the last number of weeks
$chartData = getChartData($con, $_POST['start'],$_POST['end']);
// bulding columns data for each occurence
$badColumn = buildColumn($chartData,'Bad', $numberOfWeeks);
$goodColumn = buildColumn($chartData,'Good', $numberOfWeeks);
$excellentColumn = buildColumn($chartData,'Excellent', $numberOfWeeks);

// output {data: ...}, {data: ...},{data:....}
$output = "$excellentColumn , $goodColumn , $badColumn";
Ví dụ hoạt động đầy đủ
<!DOCTYPE html>
<html>
<head>
    <title></title>
    <script src="//ajax.googleapis.com/ajax/libs/jquery/1.11.1/jquery.min.js"></script>
    <script src="jquery.flot.min.js"></script>
    <script src="jquery.flot.categories.min.js"></script>
    <script src="jquery.flot.stack.min.js"></script>
</head>
<body>
<?php
$con = mysqli_connect("localhost", 'root','','your db');

function getChartData($con, $startDate, $endDate){

    $startDate = date("Y-m-d H:i:s", strtotime($startDate));
    $endDate = date("Y-m-d H:i:s", strtotime($endDate));

    $query = "SELECT * FROM `employees` WHERE `date` BETWEEN '$startDate' AND '$endDate'";

    $result = mysqli_query($con, $query) or die ("Error: ".mysqli_error($con));

    // a multidimenional array containing each week with it's
    $weeksData = [];

    // Group each week with it's data
    while($row = mysqli_fetch_array($result)){
        $weekNumber = date("W", strtotime($row['date']));
        if(isset($weeksData[$weekNumber]))
        {
            $weeksData[$weekNumber][] = $row['level'];
        }
        $weeksData[$weekNumber][] = $row['level'];
    }

    // reset array indexes and sort the array
    sort($weeksData);

    $data = array();

    // using array_count_values to count the number of (good, bad and excellent)
    foreach ($weeksData as $key => $week) {
        $data[$key] = array_count_values($week);
    }

    // return all the weeks with number of (good, bad and excellent) occurences
    return $data;
}

// build the javascript object {data:['week num', occuerences]}
function buildColumn($data,$label, $numberOfWeeks)
{
    $data = array_column($data,strtolower($label));
    $balance = $numberOfWeeks - count($data);
    if($balance !=0){
        for($i=1;$i<=$balance;$i++) {
            $data[] = 1;
        }
    }

    $string = '{data: [';
    foreach ($data as $key => $value) {
        $weekNumber = $key+1;
        $string .= '["Week '.$weekNumber.'",'.$value.'],';
    }
    $string = rtrim($string, ',');
    $string .= "],valueLabels: {show: true,valign: 'middle'},label: '$label'}";
    return $string;
}

function getNumberofWeeks($startDate, $endDate){
      $weeks = array();
      $period = new DatePeriod(new DateTime($startDate),
        DateInterval::createFromDateString('+1 day'),new DateTime($endDate)
      );
      foreach ( $period as $dt ) {
        $weeks[] = $dt->format( 'W' );
      }
      return count(array_unique($weeks));
}
// the number of weeks that you want to display in the chart
$numberOfWeeks = getNumberofWeeks($_POST['start'],$_POST['end']);

// get data of the last number of weeks
$chartData = getChartData($con, $_POST['start'],$_POST['end']);
// bulding columns data for each occurence
$badColumn = buildColumn($chartData,'Bad', $numberOfWeeks);
$goodColumn = buildColumn($chartData,'Good', $numberOfWeeks);
$excellentColumn = buildColumn($chartData,'Excellent', $numberOfWeeks);

// output {data: ...}, {data: ...},{data:....}
$output = "$excellentColumn , $goodColumn , $badColumn";

?>
<div id="placeholder" style="width:818px;height:413px" ></div>
<script type="text/javascript">
$(function() {
    var series = [<?php echo $output; ?>];
       $.plot("#placeholder", series, {
        series: {
            stack:true,
            lines:{fill:true,show:false,steps:false},
            bars: {
                show: true,
                barWidth: 0.8,
                align: "middle",
            },
        },
        xaxis: {
            mode: "categories",
            minTickSize: 1
        }
       });
});
  </script>
 </body>
</html>
Chỉnh sửa
Chỉ cần thay thế hai hàm này để làm cho nó tương thích với dd/mm/yyyy
 function getChartData($con, $startDate, $endDate){
    $startDate = explode('/', $startDate);
    $startDate = $startDate[1] . '/' . $startDate[0] . '/' . $startDate[2];

    $endDate = explode('/', $endDate);
    $endDate = $endDate[1] . '/' . $endDate[0] . '/' . $endDate[2];

    $startDate = date("Y-m-d H:i:s", strtotime($startDate));
    $endDate = date("Y-m-d H:i:s", strtotime($endDate));

    $query = "SELECT * FROM `employees` WHERE `date` BETWEEN '$startDate' AND '$endDate'";

    $result = mysqli_query($con, $query) or die ("Error: ".mysqli_error($con));

    // a multidimenional array containing each week with it's
    $weeksData = [];

    // Group each week with it's data
    while($row = mysqli_fetch_array($result)){
        $weekNumber = date("W", strtotime($row['date']));
        if(isset($weeksData[$weekNumber]))
        {
            $weeksData[$weekNumber][] = $row['level'];
        }
        $weeksData[$weekNumber][] = $row['level'];
    }

    // reset array indexes and sort the array
    sort($weeksData);

    $data = array();

    // using array_count_values to count the number of (good, bad and excellent)
    foreach ($weeksData as $key => $week) {
        $data[$key] = array_count_values($week);
    }

    // return all the weeks with number of (good, bad and excellent) occurences
    return $data;
}
và
   function getNumberofWeeks($startDate, $endDate){
    $startDate = explode('/', $startDate);
    $startDate = $startDate[1] . '/' . $startDate[0] . '/' . $startDate[2];

    $endDate = explode('/', $endDate);
    $endDate = $endDate[1] . '/' . $endDate[0] . '/' . $endDate[2];
    $diff = strtotime($startDate, 0) - strtotime($endDate, 0);

    return str_replace('-','', (int)floor($diff / 604800));
}


